Showing posts sorted by date for query Oanda api. Sort by relevance Show all posts

Wednesday, 11 June 2025

A Replacement for my PositionBook Charts using Tick Volumes?

At the end of my previous post I said that I would be looking into using tick volume to create a new indicator, and this post is about the work I have done on this idea.

At first I tried creating a more traditional type of indicator using tick volumes separated out into buy and sell volumes, but I quickly felt that this was not a useful investment of my time so I gave up on this idea. Instead, I have come up with a way to plot tick volume levels that are similar to my previously discussed positionbook chart type, which I was forced to give up on because Oanda have discontinued the API endpoint for downloading the required data. An example of the the new, tick volume equivalent is shown below, followed by a brief description of the methodology used to create it.

Starting with the basics, if we imagine a Doji bar, for every up (down) tick there must be a corresponding and opposing down (up) tick for the bar to open and close at the exact same price and therefore we can split the tick volume for the bar equally between buy and sell tick volumes. Similarly, if we imagine a bar that opens on the low (high) and closes on the high (low), the number of ticks within the entire bar tick range can be ascribed to buy (sell) volume and the balance divided between buy and sell.

e.g. a bar opens at the low , closes at the high, with a tick range of 10 and total tick volume of 50 then:

  • buy tick volume = 10 + ( 50 - 10)/2 = 30
  • sell tick volume = 50 - buy tick volume = 20

This idea can be generalised to the range of a candlestick body being appropriately allocated to buy or sell tick volume, with the remaining balance of the total bar volume being equally allocated to buy and sell. OK, so far so good, and nothing particularly ground breaking. For the want of explaining it in a more precise manner, using the "geometry" of a bar to allocate buy and sell volumes is something that can be found online in the formulation of more than a few indicators.

The next step step is to "smear" these buy and sell volumes equally across the whole range of the bar and then take the difference:

e.g. "smeared" buy - "smeared" sell = 30 / 10 - 20 / 10 = 1, thus allocate a tick difference value of +1 for each tick level within the 10 tick range of the bar. 

Of course, over a large (e.g. 10 minute bar) this wouldn't necessarily be very informative as it is known (my volume profile bars) that the volume is usually unevenly spread across the range of any given bar. The solution to this is to apply the above methodology to the smallest bar possible, and with Oanda the smallest possible bar download is a 5 second bar. Thus what I have done is apply the above to each 5 second bar within a given 10 minute bar period and then accumulate the buy/sell/tick difference values across the individual tick levels within the 10 minute bar. This gives tick differences values that approximate the differences between each bar's separate buy and sell volume profiles.

The final step is to volume normalise the above calculations by using the total 10 minute bar tick volume such that tick differences within bars that have higher total tick volume have a greater weight than those in low tick volume bars. This is simply done by setting the total bar volume as the numerator and the tick difference as the denominator:

e.g. a tick difference of 2 at a tick level within a bar with a total 10 tick volume will get the weight

  •  10 / 2 = 5

whilst the same tick difference in a 50 tick volume bar will get the weight

  • 50 / 2 = 25
Finally, all the above is plotted as the backgound heatmap to a candlestick chart, but with a slight twist - exponential forgetting is applied along each individual tick level within the y-axis range such that if an individual tick level only has one price bar spanning it the colour slowly fades as we move along the x-axis, whilst if this level is revisited, just as with an exponential moving average, the more recent data is accumulatively weighted more. For the above plot the exponential alpha value is set at the equivalent of a 144 bar exponential moving average, i.e. the number of 10 minute bars in a 24 hour period. Shorter moving average equivalents just increase the speed at which the forgetting takes place, leading to shorter lines extending to the right, but accentuate the differences between levels; e.g. the following is the same plot as above with the equivalent of a 14 bar exponential moving average alpha value.

Earlier in this post I alluded to the possibility of this type of tick difference chart being a replacement for my unwillingly and forcefully retired PositionBook chart type. The similarities/equivalences between the two chart types I now discuss:

With the old PositionBook (PB) chart, traders' net positions at any given level and at 20 minute snapshot frequency were explicitly given by API data download and changes between snapshots were inferred by an optimisation routine. With these new TickDifference (TD) charts, traders' net positions are inferred via the methodology described above, i.e. higher normalised tick volumes at different tick levels imply a higher, net trader positioning at these levels, and changes over time in this positioning are approximated by the exponential forgetting factor.

In terms of plotting, both in the PB and TD charts, the intensities of the colours (blue for longs and red for shorts) reflect the relative importances of long/short positioning at different levels: the greater the intensity, the greater the difference between long and short positioning.

I shall now enter into a period of observational study of the usefulness of this chart type because, as the chart is inherently visual, I can't imagine how I could effectively test it in a more traditional, back testing manner. If any reader could suggest how this more traditional approach might be done, I'm all ears.    


Friday, 27 September 2024

Discontinuation of Oanda's OrderBook and PositionBook Endpoints via the V20 Framework

Longtime readers of this blog are almost certainly aware that over the last few years I have posted several times about Oanda's OrderBook and PositionBook data and what can be done with it. My first post was back in February 2022 where I posited the idea of using this data as a sentiment indicator, whilst my most recent post, March 2024, talked about substituting the data into standard, volume based indicators. In between these two dates I blogged about using the data as features for machine learning (here and here), different methods of plotting it (here with example trade and here) and an improved, associated optimisation method here.

Researching and posting about this has been interesting and I was quietly confident that there was some real value to be found doing this. However, I have recently been unpleasantly surprised and disappointed to learn (by way of my API cronjob downloading routines suddenly failing) that Oanda has decided to no longer make available the ability to download this data via their V20 API Framework. So, at a stroke, all of the above work has suddenly become redundant and effectively useless for back testing purposes or for future trading purposes. 

Did I say I was disappointed? Well, that understates it somewhat! I have written to Oanda to express my displeasure at this recent change and perhaps, fingers crossed, they will reinstate this V20 functionality.

Friday, 24 May 2024

Using Oanda's API to Place Entry Orders

Since my last post about end of initial testing I have been working on Oanda API functions in Octave to programmatically place entry orders and associated take profit and stop orders for a future possible forex news trading system. The reason for this is simple - it would be next to impossible to manually place a series of entry orders in the last few moments before a news release, so this would have to be done automatically. To this end, I have spent the last few weeks writing a few simple entry functions and testing them in my live trading account with the minimum trading size, i.e. buying and selling 1 Euro in the EURUSD forex pair and observing the subsequent lines at the entry/stop/take profit levels that appear on the live web platform.

The basic schema for this is shown in the following code box, where it can be seen that

body = jsonencode( struct( 'order' , struct( 'units' , num2str( 1 ) , ...
                                              'instrument' , 'EUR_USD' , ...
                                              'timeInForce' , 'FOK' , ...
                                              'type' , 'MARKET' , ...
                                              'trailingStopLossOnFill' , struct( 'distance' , num2str( trail_distance ) , ...
                                                                                  'timeInForce' , 'GTC' , ...
                                                                                  'triggerCondition' , 'MID' ) , ...
                                              'positionFill' , 'DEFAULT' ) ) )

account_header = ['curl -X POST -H "Content-Type: application/json" -H "Authorization: Bearer TOKEN"'] ;

submit_order = [ account_header , ' "https://api-fxtrade.oanda.com/v3/accounts/ACCOUNT/orders"' , ' -d ' , "'" , body , "'" ] ;

[ ~ , ret_JSON ] = system( submit_order , RETURN_OUTPUT = 'TRUE' ) ;

a JSON object containing the order details is created, HTML headers with account information are added, and then the order is dispatched via a system call to the cURL library.

A more complete Octave function example is shown next. This is a buy on a stop entry function which also sets a stop loss and take profit target level on being filled, and there is also some basic input checking.

function [ ret_JSON ] = buy_stop_entry_with_stoploss_and_takeprofit( cross , no_of_units , entry_price_level , stop_level , take_profit_level )

## some basic checks
if ( entry_price_level <= stop_level )
   error( 'Stop Level is not below Entry Level.' ) ;
endif

if ( entry_price_level >= take_profit_level )
   error( 'Take Profit Level is not above Entry Level.' ) ;
endif

account_header = ['curl -X POST -H "Content-Type: application/json" -H "Authorization: Bearer TOKEN"'] ;

body = jsonencode( struct( 'order' , struct( 'type' , 'STOP' , ...
                                              'instrument' , toupper( cross ) , ...
                                              'units' , num2str( abs( no_of_units ) ) , ...
                                              'price' , num2str( entry_price_level ) , ...
                                              'stopLossOnFill' , struct( 'price' , num2str( stop_level ) , ...
                                                                         'timeInForce' , 'GTC' ) , ...
                                              'takeProfitOnFill' , struct( 'price' , num2str( take_profit_level ) ) , ...
                                              'timeInForce' , 'GTC' , ...
                                              'triggerCondition' , 'MID' , ...
                                              'positionFill' , 'DEFAULT' ) ) ) ;

submit_order = [ account_header , ' -d ' , "'" , body , "'" , ' "https://api-fxtrade.oanda.com/v3/accounts/ACCOUNT/orders"' ] ;

[ ~ , ret_JSON ] = system( submit_order , RETURN_OUTPUT = 'TRUE' ) ;

ret_JSON = jsondecode( ret_JSON ) ;

endfunction

I won't spend much time explaining the contents of the JSON body as readers can find more information about this in Oanda's online documentation, however, there is one important thing I would note here and that is the key/value pair

 'triggerCondition' , 'MID'

The 'default' value for this is the bid/ask price for sells/buys which, in the case of a news trading system, could be problematic because the spread may very well be widened prior to a news release and trigger an entry without the underlying price actually having moved to the entry level, or even before the news is released. By setting the trigger condition to 'MID' a trade will be entered when the mid-price hits the entry level. The trade-off in this choice is summarised thus:

  • if the 'default' value is used, entries on "good" trades will be much closer to the entry level, on average, but at the possible expense of far more false entries and therefore losing trades, versus:
  • if the 'MID' value is used, there will possibly be fewer false entries, but at the expense of a worse entry price for "good" trades.
 This is a trade-off that will have to be investigated/tested in due course.

Friday, 11 November 2022

A New PositionBook Chart Type

It has been almost 6 months since I last posted, due to working on a house renovation. However, I have still been thinking about/working on stuff, particularly on analysis of open position ratios. I had tried using this data as features for machine learning, but my thinking has evolved somewhat and I have reduced my ambition/expectation for this type of data.

Before I get into this I'd like to mention Trader Dale (I have no affiliation with him) as I have recently been following his volume profile set-ups, a screenshot of one being shown below.

This shows recent Wednesday action in the EUR_GBP pair on a 30 minute chart. The flexible volume profile set-up Trader Dale describes is called a Volume Accumulation Set-up which occurs immediately prior to a big break (in this case up). The whole premise of this particular set-up is that the volume accumulation area will be future support, off of which price will bounce, as shown by the "hand drawn" lines. Below is shown my version of the above chart
with a bit of extra price action included. The horizontal yellow lines show the support area.

Now here is the same data, but in what I'm calling a PositionBook chart, which uses Oanda's Position Level data downloaded via their API.

The blue (red) horizontal lines show the levels at which traders are net long (short) in terms of positions actually entered/held. The brighter the colours the greater the difference between the longs/shorts. It is obvious that the volume accumulation set-up area is showing a net accumulation of long positions and this is an indication of the direction of the anticipated breakout long before it happens. The Trader Dale set-up presumes an accumulation of longs because of the resultant breakout direction and doesn't seem to provide an opportunity to participate in the breakout itself!

The next chart shows the action of the following day and a bit where the price does indeed come back down to the "support" area but doesn't result in an immediate bounce off the support level. The following order level chart perhaps shows why there was no bounce - the relative absence of open orders at that level.

The equivalent PositionBook chart, including a bit more price action,
shows that after price fails to bounce off the support level it does recover back into it and then even more long positions are accumulated (the darker blue shade) at the support level during the London open, again allowing one to position oneself for the ensuing rise during the London morning session, followed by another long accumulation during the New York opening session for a following leg up into the London close (the last vertical red line).

This purpose of this post is not to criticise the Trader Dale set-up but rather to highlight the potential value-add of these new PositionBook charts. They seem to hold promise for indicating price direction and I intend to continue investigating/improving them in the coming weeks.

More in due course.

Friday, 25 March 2022

OrderBook and PositionBook Features

In my previous post I talked about how I planned to use constrained optimization to create features from Oanda's OrderBook and PositionBook data, which can be downloaded via their API. In addition to this I have also created a set of features based on the idea of Order Flow Imbalance (OFI), a nice exposition of which is given in this blog post along with a numerical example of how to calculate OFI. Of course Oanda's OrderBook/PositionBook data is not exactly the same as a conventional limit order book, but I thought they are similar enough to investigate using OFI on them. The result of these investigations is shown in the animated GIF below.

This shows the output from using the R Boruta package to check for the feature relevance of OFI levels to a depth of 20 of both the OrderBook and PositionBook to classify the sign of the log return of price over the periods detailed below following an OrderBook/PositionBook update (the granularity at which the OrderBook/PositionBook data can be updated is 20 minutes):

  • 20 minutes
  • 40 minutes
  • 60 minutes
  • the 20 minutes starting 20 minutes in the future
  • the 20 minutes starting 40 minutes in the future
for both the OrderBook and PositionBook, giving a total of 10 separate images/results in the above GIF.
 
Observant readers may notice that in the GIF there are 42 features being checked, but only an OFI depth of 20. The reason for this is that the data contain information about buys/sell orders and long/short positions both above and below the current price, so what I did was calculate OFI for:
  • buy orders above price vs sell orders below price
  • sell orders above price vs buy orders below price
  • long positions above price vs short positions below price
  • short positions above price vs long positions below price 
As can be seen, almost all features are deemed to be relevant with the exception of 3 OFI levels rejected (red candles) and 2 deemed tentative (yellow candles).

It is my intention to use these features in a machine learning model to classify the probability of future market direction over the time frames mentioned above. 

More in due course.

Tuesday, 15 February 2022

A Possible, New Positionbook Indicator?

In my previous post I ended with saying that I would post about some sort of "sentiment indicator" if, and only if, I had something positive to say about my progress on this work. This post is the first on this subject.

The indicator I'm working on is based on the open position ratios data that is available via the Oanda api. For the uninitiated, this data gives the percentage of traders holding long and short positions, and at what price levels, in 14 selected forex pairs and also gold and silver. The data is updated every 20 minutes. I have long felt that there must be some value hidden in this data but the problem is how to extract it.

What I've done is take the percentage values from the (usually) hundreds of separate price levels and sum and normalise them over three defined ranges - levels above/below the high/low of each 20 minute period and the level(s) that span the price range of this period. This is done separately for long and short positions to give a total of 6 percentage figures that sum to 100%. Conceptually, this can be thought of as attaching to the open and close of a 20 minute OHLC bar the 6 percentage position values that were in force at the open and close respectively. The problem is to try and infer the actual, net changes in positions that have taken place over the time period this 20 minute bar was forming. In this way I am trying, if you like, to create a sort of  "skin in the game" indicator as opposed to an indicator derived from order book data, which could be said to be based on traders' current (changeable) intentions as expressed by their open orders and which are subject to shenanigans such as spoofing.

The methodology I've decided on to realise the above is constrained optimization using Octave's fmincon function. The objective function is simply:

    denom = X' * old_pb_net_pos ;
    J = mean( ( new_pb_net_pos .- ( ( X .* old_pb_net_pos ) ./ denom ) ).^2 ) ;

for a multiplicative position value change model where:

  • X is a vector of constants that are to be optimised
  • old_pb_net_pos is a vector of the 6 percentage values at the open
  • new_pb_net_pos is a vector of the 6 percentage values at the close

This is a constrained model because percentage position values at price levels outside the bar range cannot actually increase as a result of trades that take place within the bar range, so the X values for these levels are necessarily constrained to a maximum value of 1 (implying no real, absolute change at these levels). Similarly, all X values must be greater than zero (a zero value would imply a mass exit of all positions at this level, which never actually happens).

The net result of the above is an optimised X vector consisting of multiplicative constants that are multiplied with old_pb_net_pos to achieve new_pb_net_pos according to the logic exemplified in the above objective function. It is these optimised X values from which the underlying, real changes in positions will be inferred and features created. More on this in my next post.


Tuesday, 4 January 2022

Matrix Profile and Weakly Labelled Data - 2nd and Final Update

It has been over three months since my last post, which was intended to be the first in a series of posts on the subject of the title of this post. However, it turned out that the results of my work were underwhelming and so I decided to stop flogging a dead horse and move onto other things. I still have some ideas for using Matrix Profile, but not for the above. These ideas may be the subject of a future blog post.

I subsequently looked at plotting order levels using the data that is available via the Oanda API and I have come up with Octave code to render plots such as this:

where the brighter yellow stripes show ranges where there is an accumulation of sell/buy orders above/below price. These can be interpreted as support/resistance areas. It is normally my practice to post my Octave code, but the code for this plot is quite idiosyncratic and depends very much on the way I have chosen to store the underlying data downloaded from Oanda. As such, I don't think it would be helpful to readers and so I am not posting the code. That said, if there is actually a demand I am more than happy to make it available in a future blog post.

Having done this, it seemed natural to extend it to Open Position Ratios which are also available via the Oanda API. Plotting these levels renders plots that are similar to the plot shown above, but show levels where open long/short positions instead of open orders are accumulated. Although such plots are visually informative, I prefer something more objective, and so for the last few weeks I have been working on using the open position ratios data to construct some sort of sentiment indicator that hopefully could give a heads up to future price movement direction. This is still very much a work in progress which I shall post about if there are noteworthy results.

More in due course.

Wednesday, 15 July 2020

Forex Intraday Seasonality

Over the last week or so I have been reading about/investigating this post's title matter. Some quotes from various papers' abstracts on the matter are:
  • "We provide empirical evidence that the unique signature of the FX market seasonality is indeed due to the different time zones market participants operate from. However, once normalised using our custom-designed procedure, we observe a pattern akin to equity markets. Thus, we have revealed an important FX market property that has not been reported before." - Phd. paper - April 2013
  • "Using 10 years of high‐frequency foreign exchange data, we present evidence of time‐of‐day effects in foreign exchange returns through a significant tendency for currencies to depreciate during local trading hours. We confirm this pattern across a range of currencies and find that, in the case of EUR/USD, it can form a simple, profitable trading strategy" - Paper date - November 2010 - emphasis is mine
  • "This paper examines the intraday seasonality of transacted limit and market orders in the DEM/USD foreign exchange market. Empirical analysis of completed transactions data based on the Dealing 2000-2 electronic inter-dealer broking system indicates significant evidence of intraday seasonality in returns and return volatilities under usual market conditions. Moreover, analysis of realised tail outcomes supports seasonality for extraordinary market conditions across the trading day." - Paper date - May 2007
  • "In this article, we search for the evidence of intraweek and intraday anomalies on the spot foreign exchange (FOREX) market. Having in mind the international scope of this market ... We find that intraday and interaction between day and hour anomalies are present in trading EUR/USD on the spot FOREX market over the period of 10 years" - Paper date - 2014
  • "We find that the underpinnings for the time-varying pattern of the probability of informed trading are rooted in the strategic arrival of informed traders on a particular hour-of-day, day-of-week, and geographic location (market)." - Paper date - April 2008
In addition to this there seem to be numerous blogs, articles online etc. which also suggest that forex seasonality is a real phenomenon, so I thought I'd have a quick look into it myself.

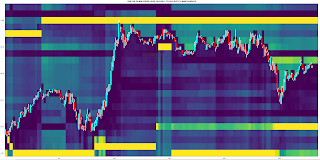
Rather than do a full, statistical analysis I have used the following Octave function
clear all ;
data = dlmread( '/home/path/to/hourly_currency_index_g_mults' ) ;
## aud_x = x( 1)  ; cad_x = x( 2 ) ; chf_x = x( 3 ) ; eur_x = x( 4 ) ; gbp_x = x( 5 ) ; hkd_x = x( 6 ) ;
## jpy_x = x( 7 ) ; nzd_x = x( 8 ) ; sgd_x = x( 9 ) ; usd_x = x( 10 ) ; ## plus 6 for ix to account for date cols
## first 6 cols are YYYY MM DD HH-GMT HH-BST HH-EST
logged_data = data ; logged_data( : , 7 : end ) = log( logged_data( : , 7 : end ) ) ;

## get the days. The days of the week are numbered 1–7 with the first day being Sunday.
days_num = weekday( datenum( [ data(:,1) , data(:,2) , data(:,3) , data(:,5) ] ) ) ; ## BST time

start = input( 'Do you want to enter start date? Y or N ' , 's' ) ;
if ( strcmp( tolower( start ) , 'y' ) )
 year_start = input( 'Enter year YYYY:  ' ) ;
 month_start = input( 'Enter month MM:  ' ) ;
 day_start = input( 'Enter day date:  ' ) ;
 delete_ix = find( (logged_data(:,1)==year_start) .* (logged_data(:,2)==month_start) .* (logged_data(:,3)==day_start) ) ;
 
 if ( !isempty( delete_ix ) )
 logged_data( 1 : delete_ix , : ) = [] ; days_num( 1 : delete_ix , : ) = [] ;
 else
 disp( 'Invalid start date, so charts will show all data.' ) ;
 endif

endif

## create individual day indices
monday_indices = [ ( 0 : 1 : 23 )' , zeros( 24 , 10 ) ] ;
tuesday_indices = monday_indices ;
wednesday_indices = monday_indices ;
thursday_indices = monday_indices ;
friday_indices = monday_indices ;
alldays_indices = monday_indices ;

running_denom = zeros( 24 , 10 ) ;

for jj = 0 : 23
ix = find( ( days_num == 2 ) .* ( logged_data( : , 5 ) == jj ) ) ;
running_denom( jj + 1 , : ) = running_denom( jj + 1 , : ) + numel( ix ) ;
monday_indices( jj + 1 , 2 : end ) = sum( logged_data( ix , 7 : end ) , 1 ) ./ numel( ix ) ;
alldays_indices( jj + 1 , 2 : end ) = sum( logged_data( ix , 7 : end ) , 1 ) ;
endfor

for jj = 0 : 23
ix = find( ( days_num == 3 ) .* ( logged_data( : , 5 ) == jj ) ) ;
running_denom( jj + 1 , : ) = running_denom( jj + 1 , : ) + numel( ix ) ;
tuesday_indices( jj + 1 , 2 : end ) = sum( logged_data( ix , 7 : end ) , 1 ) ./ numel( ix ) ;
alldays_indices( jj + 1 , 2 : end ) = alldays_indices( jj + 1 , 2 : end ) .+ sum( logged_data( ix , 7 : end ) , 1 ) ;
endfor

for jj = 0 : 23
ix = find( ( days_num == 4 ) .* ( logged_data( : , 5 ) == jj ) ) ;
running_denom( jj + 1 , : ) = running_denom( jj + 1 , : ) + numel( ix ) ;
wednesday_indices( jj + 1 , 2 : end ) = sum( logged_data( ix , 7 : end ) , 1 ) ./ numel( ix ) ;
alldays_indices( jj + 1 , 2 : end ) = alldays_indices( jj + 1 , 2 : end ) .+ sum( logged_data( ix , 7 : end ) , 1 ) ;
endfor

for jj = 0 : 23
ix = find( ( days_num == 5 ) .* ( logged_data( : , 5 ) == jj ) ) ;
running_denom( jj + 1 , : ) = running_denom( jj + 1 , : ) + numel( ix ) ;
thursday_indices( jj + 1 , 2 : end ) = sum( logged_data( ix , 7 : end ) , 1 ) ./ numel( ix ) ;
alldays_indices( jj + 1 , 2 : end ) = alldays_indices( jj + 1 , 2 : end ) .+ sum( logged_data( ix , 7 : end ) , 1 ) ;
endfor

for jj = 0 : 20 ## market closes at 17:00 EST
ix = find( ( days_num == 6 ) .* ( logged_data( : , 5 ) == jj ) ) ;
running_denom( jj + 1 , : ) = running_denom( jj + 1 , : ) + numel( ix ) ;
friday_indices( jj + 1 , 2 : end ) = sum( logged_data( ix , 7 : end ) , 1 ) ./ numel( ix ) ;
alldays_indices( jj + 1 , 2 : end ) = alldays_indices( jj + 1 , 2 : end ) .+ sum( logged_data( ix , 7 : end ) , 1 ) ;
endfor

alldays_indices( : , 2 : end ) = alldays_indices( : , 2 : end ) ./ running_denom ;

monday_indices( : , 2 : end ) = cumsum( monday_indices( : , 2 : end ) ) ;
tuesday_indices( : , 2 : end ) = cumsum( tuesday_indices( : , 2 : end ) ) ;
wednesday_indices( : , 2 : end ) = cumsum( wednesday_indices( : , 2 : end ) ) ;
thursday_indices( : , 2 : end ) = cumsum( thursday_indices( : , 2 : end ) ) ;
friday_indices( : , 2 : end ) = cumsum( friday_indices( : , 2 : end ) ) ;
alldays_indices( : , 2 : end ) = cumsum( alldays_indices( : , 2 : end ) ) ;

if ( ishandle(1) )
 clf(1) ;
endif
figure( 1 ) ;
h1 = axes( 'position' , [ 0.03 , 0.54 , 0.30 , 0.43 ] ) ; plot( monday_indices(:,3) , 'k' , 'linewidth' , 2 , ...
monday_indices(:,4) , 'c' , 'linewidth' , 2 , ...
monday_indices(:,5) , 'b' , 'linewidth' , 2 , ...
monday_indices(:,6) , 'r' , 'linewidth' , 2 , ...
monday_indices(:,11) , 'g' , 'linewidth' , 2 ) ; xlim([0 23]) ; grid minor on ; title( 'MONDAY' ) ;
legend( 'CAD' , 'CHF' , 'EUR' , 'GBP' , 'USD' , 'location' , 'north' , 'orientation' , 'horizontal' ) ;
vline( 7 , 'r' ) ; vline( 12 , 'g' ) ;

h2 = axes( 'position' , [ 0.36 , 0.54 , 0.30 , 0.43 ] ) ; plot( tuesday_indices(:,3) , 'k' , 'linewidth' , 2 , ...
tuesday_indices(:,4) , 'c' , 'linewidth' , 2 , ...
tuesday_indices(:,5) , 'b' , 'linewidth' , 2 , ...
tuesday_indices(:,6) , 'r' , 'linewidth' , 2 , ...
tuesday_indices(:,11) , 'g' , 'linewidth' , 2 ) ; xlim([0 23]) ; grid minor on ; title( 'TUESDAY' ) ;
legend( 'CAD' , 'CHF' , 'EUR' , 'GBP' , 'USD' , 'location' , 'north' , 'orientation' , 'horizontal' ) ;
vline( 7 , 'r' ) ; vline( 12 , 'g' ) ;

h3 = axes( 'position' , [ 0.69 , 0.54 , 0.30 , 0.43 ] ) ; plot( wednesday_indices(:,3) , 'k' , 'linewidth' , 2 , ...
wednesday_indices(:,4) , 'c' , 'linewidth' , 2 , ...
wednesday_indices(:,5) , 'b' , 'linewidth' , 2 , ...
wednesday_indices(:,6) , 'r' , 'linewidth' , 2 , ...
wednesday_indices(:,11) , 'g' , 'linewidth' , 2 ) ; xlim([0 23]) ; grid minor on ; title( 'WEDNESDAY' ) ;
legend( 'CAD' , 'CHF' , 'EUR' , 'GBP' , 'USD' , 'location' , 'north' , 'orientation' , 'horizontal' ) ;
vline( 7 , 'r' ) ; vline( 12 , 'g' ) ;

h4 = axes( 'position' , [ 0.03 , 0.04 , 0.30 , 0.43 ] ) ; plot( thursday_indices(:,3) , 'k' , 'linewidth' , 2 , ...
thursday_indices(:,4) , 'c' , 'linewidth' , 2 , ...
thursday_indices(:,5) , 'b' , 'linewidth' , 2 , ...
thursday_indices(:,6) , 'r' , 'linewidth' , 2 , ...
thursday_indices(:,11) , 'g' , 'linewidth' , 2 ) ; xlim([0 23]) ; grid minor on ; title( 'THURSDAY' ) ;
legend( 'CAD' , 'CHF' , 'EUR' , 'GBP' , 'USD' , 'location' , 'north' , 'orientation' , 'horizontal' ) ;
vline( 7 , 'r' ) ; vline( 12 , 'g' ) ;

h5 = axes( 'position' , [ 0.36 , 0.04 , 0.30 , 0.43 ] ) ; plot( friday_indices(:,3) , 'k' , 'linewidth' , 2 , ...
friday_indices(:,4) , 'c' , 'linewidth' , 2 , ...
friday_indices(:,5) , 'b' , 'linewidth' , 2 , ...
friday_indices(:,6) , 'r' , 'linewidth' , 2 , ...
friday_indices(:,11) , 'g' , 'linewidth' , 2 ) ; xlim([0 21]) ; grid minor on ; title( 'FRIDAY' ) ;
legend( 'CAD' , 'CHF' , 'EUR' , 'GBP' , 'USD' , 'location' , 'north' , 'orientation' , 'horizontal' ) ;
vline( 7 , 'r' ) ; vline( 12 , 'g' ) ;

h6 = axes( 'position' , [ 0.69 , 0.04 , 0.30 , 0.43 ] ) ; plot( alldays_indices(:,3) , 'k' , 'linewidth' , 2 , ...
alldays_indices(:,4) , 'c' , 'linewidth' , 2 , ...
alldays_indices(:,5) , 'b' , 'linewidth' , 2 , ...
alldays_indices(:,6) , 'r' , 'linewidth' , 2 , ...
alldays_indices(:,11) , 'g' , 'linewidth' , 2 ) ; xlim([0 23]) ; grid minor on ; title( 'ALL DAYS COMBINED' ) ;
legend( 'CAD' , 'CHF' , 'EUR' , 'GBP' , 'USD' , 'location' , 'north' , 'orientation' , 'horizontal' ) ;
vline( 7 , 'r' ) ; vline( 12 , 'g' ) ;

if ( ishandle(2) )
 clf(2) ;
endif
figure( 2 ) ;
h1 = axes( 'position' , [ 0.03 , 0.54 , 0.30 , 0.43 ] ) ; plot( monday_indices(:,2) , 'k' , 'linewidth' , 2 , ...
monday_indices(:,7) , 'c' , 'linewidth' , 2 , ...
monday_indices(:,8) , 'b' , 'linewidth' , 2 , ...
monday_indices(:,9) , 'r' , 'linewidth' , 2 , ...
monday_indices(:,10) , 'g' , 'linewidth' , 2 ) ; xlim([0 23]) ; grid minor on ; title( 'MONDAY' ) ;
legend( 'AUD' , 'HKD' , 'JPY' , 'NZD' , 'SGD' , 'location' , 'north' , 'orientation' , 'horizontal' ) ;
vline( 7 , 'r' ) ; vline( 12 , 'g' ) ;

h2 = axes( 'position' , [ 0.36 , 0.54 , 0.30 , 0.43 ] ) ; plot( tuesday_indices(:,2) , 'k' , 'linewidth' , 2 , ...
tuesday_indices(:,7) , 'c' , 'linewidth' , 2 , ...
tuesday_indices(:,8) , 'b' , 'linewidth' , 2 , ...
tuesday_indices(:,9) , 'r' , 'linewidth' , 2 , ...
tuesday_indices(:,10) , 'g' , 'linewidth' , 2 ) ; xlim([0 23]) ; grid minor on ; title( 'TUESDAY' ) ;
legend( 'AUD' , 'HKD' , 'JPY' , 'NZD' , 'SGD' , 'location' , 'north' , 'orientation' , 'horizontal' ) ;
vline( 7 , 'r' ) ; vline( 12 , 'g' ) ;

h3 = axes( 'position' , [ 0.69 , 0.54 , 0.30 , 0.43 ] ) ; plot( wednesday_indices(:,2) , 'k' , 'linewidth' , 2 , ...
wednesday_indices(:,7) , 'c' , 'linewidth' , 2 , ...
wednesday_indices(:,8) , 'b' , 'linewidth' , 2 , ...
wednesday_indices(:,9) , 'r' , 'linewidth' , 2 , ...
wednesday_indices(:,10) , 'g' , 'linewidth' , 2 ) ; xlim([0 23]) ; grid minor on ; title( 'WEDNESDAY' ) ;
legend( 'AUD' , 'HKD' , 'JPY' , 'NZD' , 'SGD' , 'location' , 'north' , 'orientation' , 'horizontal' ) ;
vline( 7 , 'r' ) ; vline( 12 , 'g' ) ;

h4 = axes( 'position' , [ 0.03 , 0.04 , 0.30 , 0.43 ] ) ; plot( thursday_indices(:,2) , 'k' , 'linewidth' , 2 , ...
thursday_indices(:,7) , 'c' , 'linewidth' , 2 , ...
thursday_indices(:,8) , 'b' , 'linewidth' , 2 , ...
thursday_indices(:,9) , 'r' , 'linewidth' , 2 , ...
thursday_indices(:,10) , 'g' , 'linewidth' , 2 ) ; xlim([0 23]) ; grid minor on ; title( 'THURSDAY' ) ;
legend( 'AUD' , 'HKD' , 'JPY' , 'NZD' , 'SGD' , 'location' , 'north' , 'orientation' , 'horizontal' ) ;
vline( 7 , 'r' ) ; vline( 12 , 'g' ) ;

h5 = axes( 'position' , [ 0.36 , 0.04 , 0.30 , 0.43 ] ) ; plot( friday_indices(:,2) , 'k' , 'linewidth' , 2 , ...
friday_indices(:,7) , 'c' , 'linewidth' , 2 , ...
friday_indices(:,8) , 'b' , 'linewidth' , 2 , ...
friday_indices(:,9) , 'r' , 'linewidth' , 2 , ...
friday_indices(:,10) , 'g' , 'linewidth' , 2 ) ; xlim([0 21]) ; grid minor on ; title( 'FRIDAY' ) ;
legend( 'AUD' , 'HKD' , 'JPY' , 'NZD' , 'SGD' , 'location' , 'north' , 'orientation' , 'horizontal' ) ;
vline( 7 , 'r' ) ; vline( 12 , 'g' ) ;

h6 = axes( 'position' , [ 0.69 , 0.04 , 0.30 , 0.43 ] ) ; plot( alldays_indices(:,2) , 'k' , 'linewidth' , 2 , ...
alldays_indices(:,7) , 'c' , 'linewidth' , 2 , ...
alldays_indices(:,8) , 'b' , 'linewidth' , 2 , ...
alldays_indices(:,9) , 'r' , 'linewidth' , 2 , ...
alldays_indices(:,10) , 'g' , 'linewidth' , 2 ) ; xlim([0 23]) ; grid minor on ; title( 'ALL DAYS COMBINED' ) ;
legend( 'AUD' , 'HKD' , 'JPY' , 'NZD' , 'SGD' , 'location' , 'north' , 'orientation' , 'horizontal' ) ;
vline( 7 , 'r' ) ; vline( 12 , 'g' ) ;
to conduct a quick visual analysis. This builds upon my recent work on fx pairs via oanda api and currency strength, and uses hourly data since June 2012.

This produces 24 hour seasonality charts of CAD, CHF, EUR, GBP and USD, i.e. the European and North American currencies.
The x-axis is in British Summer Time (BST) hours, the vertical red and green lines indicate 7:00am opens in London and New York respectively, all charts end at 17:00 New York (EST) time and the y-axis is hourly log returns. The individual currency seasonality lines are the cummulative cross-sectional means at BST 00, BST 01 ... etc. per weekday and all days combined (see subchart titles). BST Sunday evenings' returns prior to Monday trading are not included.

A similar chart for the Asian time zone currencies of AUD, HKD, JPY, NZD and SGD is also produced.
The function allows charts with a user selected data begin date to be plotted, but the illustrations above use all data available to me, i.e. hourly data since 2012.

It seems to me that, as indicated in my highlighting above, there is definite intraday forex seasonalilty in play. However, readers should be cautioned that the above is only a general tendency based on the last 9 years or so of hourly data. A more recent "data snapshot" of only data since the beginning of 2020 can tell a slightly different story:
look at GBP (red line) on Tuesdays and Wednesdays, for example. As always with stuff one reads online, even the extremely high quality stuff on this blog 😊, Caveat emptor.

Thursday, 18 June 2020

More Work on RVFL Networks

Back in November last year I posted about Random Vector Functional Link (RVFL) networks here and here. Since then, along with my recent work on Oanda's API Octave functions and Market/Volume Profile visualisation, I have continued looking at RVFL networks and this post is an update on this work.

The "random" in RVFL means random initialisation of weights that are then fixed. It seems to me that it might be possible to do better than random by having some principled way of weight initialisation. To this end I have used the Penalised MATLAB Toolbox on features derived from my ideal cyclic tau embedding function to at first train a Generalized Linear Model with the Lasso penalty and then the Ridge penalty over thousands of sets of Monte Carlo generated, ideal cyclic prices and such prices with trends. The best weights for each set of prices were recorded in an array and then the mean weight (and standard deviation) taken. This set of mean weights is intended to replace the random weights in a RVFL network designed to predict the probability of "price" being at a cyclic turning point using the above cyclic tau embedding features.

Of course these weights could be considered a trained model in and of themselves, and the following screenshots show "out of sample" performance on Monte Carlo generated ideal prices that were not used in the training of the mean weights.
The black line is the underlying cyclic price and the red, blue and green lines are the mean weight model probabilities for cyclic peaks, troughs or neither respectively. Points where the peak/trough probabilities exceed the neither probabilities are marked by the red and blue vertical lines. Similarly, we have prices trending up in a cyclic fashion
and also trending down
In the cases of the last two trending markets only the swing highs and lows are indicated. The reason for this is that during training, based on my "expert knowledge" of the cyclic tau features used, it is unreasonable to expect these features to accurately capture the end of an up leg in a bull trend or the end of a down leg in a bear trend - hence these were not presented as a positive class during training.

As I said above the motivation for this is to get a more meaningful hidden layer in a RVFL network. This hidden layer will consist of seven Sigmoid functions which each give a probability of price being at or not being at a cyclic turn, conditional upon the type of market the input weights were trained on.

More in due course.

Saturday, 6 June 2020

Downloading FX Pairs via Oanda API to Calculate Currency Strength Indicator

In the past I have posted a series of blog posts about a Currency Strength Indicator (here, here, here and here). This blog post gives an Octave function to use Oanda's API to download all the 10 minute OHLC data required to calculate the above strength indicators on the 10 minute time frame.
## Copyright (C) 2020 dekalog
## 
## This program is free software: you can redistribute it and/or modify it
## under the terms of the GNU General Public License as published by
## the Free Software Foundation, either version 3 of the License, or
## (at your option) any later version.
## 
## This program is distributed in the hope that it will be useful, but
## WITHOUT ANY WARRANTY; without even the implied warranty of
## MERCHANTABILITY or FITNESS FOR A PARTICULAR PURPOSE.  See the
## GNU General Public License for more details.
## 
## You should have received a copy of the GNU General Public License
## along with this program.  If not, see
## .

## -*- texinfo -*- 
## @deftypefn {} {@var{retval} =} get_currency_index_10m_pairs()
##
## This function gets the date and time value of the last currency index update for
## 10 minute bars by reading the last line of the file at:
##
## "/home/path/to/file"
##
## and then downloads all the currencies required to calculate new values for
## new currency index calculations, via looped Oanda API calls. 
## 
##The RETVAL is a matrix of GMT dates in the form
## YYYY:MM:DD:HH:MM in the first 5 columns, followed by the 45 required
## currency candlestick close values.
##
## @seealso{}
## @end deftypefn

## Author: dekalog 
## Created: 2020-06-01

function retval = get_currency_index_10m_pairs()
 
## cell array of currency crosses to iterrate over to get the complete set 
## of currency crosses to create a currency index
iter_vec = {'AUD_CAD','AUD_CHF','AUD_HKD','AUD_JPY','AUD_NZD','AUD_SGD',...
'AUD_USD','CAD_CHF','CAD_HKD','CAD_JPY','CAD_SGD','CHF_HKD','CHF_JPY',...
'EUR_AUD','EUR_CAD','EUR_CHF','EUR_GBP','EUR_HKD','EUR_JPY','EUR_NZD',...
'EUR_SGD','EUR_USD','GBP_AUD','GBP_CAD','GBP_CHF','GBP_HKD','GBP_JPY',...
'GBP_NZD','GBP_SGD','GBP_USD','HKD_JPY','NZD_CAD','NZD_CHF','NZD_HKD',...
'NZD_JPY','NZD_SGD','NZD_USD','SGD_CHF','SGD_HKD','SGD_JPY','USD_CAD',...
'USD_CHF','USD_HKD','USD_JPY','USD_SGD'} ;

## read last line of current 10min_currency_indices
unix_command = [ "tail -1" , " " , "/home/path/to/file" ] ;
[ ~ , data ] = system( unix_command ) ;
data = strsplit( data , ',' ) ; ## gives a cell arrayfun of characters
## zero pad singular month representations, i.e. 1 to 01
if ( numel( data{ 2 } == 1 ) )
data{ 2 } = [ '0' , data{ 2 } ] ;
endif
## and also zero pad singular dates
if ( numel( data{ 3 } == 1 ) )
data{ 3 } = [ '0' , data{ 3 } ] ;
endif
## and also zero pad singular hours
if ( numel( data{ 4 } == 1 ) )
data{ 4 } = [ '0' , data{ 4 } ] ;
endif
## and also zero pad singular minutes
if ( numel( data{ 5 } == 1 ) )
data{ 5 } = [ '0' , data{ 5 } ] ;
endif
 
## set up the headers
Hquery = [ 'curl -s -H "Content-Type: application/json"' ] ; ## -s is silent mode for Curl for no paging to terminal
Hquery = [ Hquery , ' -H "Authorization: Bearer XXXXXXXXXXXXXXXXXXXXXXXXXXXXXXXXXXXXXXXXXXXXXXXXXXXXXXXXXXXXX"' ] ;
query_begin = [ Hquery , ' "https://api-fxtrade.oanda.com/v3/instruments/' ] ;

## get time from last line of data
query_time = [ data{1} , '-' , data{2} , '-' , data{3} , 'T' , data{4} , '%3A' , data{5} , '%3A00.000000000Z&granularity=M10"' ] ;

## initialise with AUD_CAD
## construct the API call for particular cross
query = [ query_begin , iter_vec{ 1 } , '/candles?includeFirst=true&price=M&from=' , query_time ] ;
## call to use external Unix systems/Curl and return result
[ ~ , ret_JSON ] = system( query , RETURN_OUTPUT = 'TRUE' ) ;
## convert the returned JSON object to Octave structure
S = load_json( ret_JSON ) ;
## parse the returned structure S
if ( strcmp( fieldnames( S( 1 ) ) , 'errorMessage' ) == 0 ) ## no errorMessage in S
end_ix = numel( S.candles ) ; ## how many candles?
if ( S.candles{ end }.complete == 0 ) end_ix = end_ix - 1 ; endif ## account for incomplete candles
## create retval
retval = zeros( end_ix , 50 ) ; ## 45 currencies plus YYYY:MM:DD:HH:MM columns
for ii = 1 : end_ix
 date_time = strsplit( S.candles{ ii }.time , { '-' , 'T' , ':' } ) ;
 retval( ii , 1 ) = str2double( date_time( 1 , 1 ) ) ; ## year
 retval( ii , 2 ) = str2double( date_time( 1 , 2 ) ) ; ## month
 retval( ii , 3 ) = str2double( date_time( 1 , 3 ) ) ; ## day
 retval( ii , 4 ) = str2double( date_time( 1 , 4 ) ) ; ## hour
 retval( ii , 5 ) = str2double( date_time( 1 , 5 ) ) ; ## min
 retval( ii , 6 ) = str2double( S.candles{ ii }.mid.c ) ; ## candle close price 
endfor ## end of ii loop
else
error( 'Initialisation with AUD_CAD has failed.' ) ; 
endif ## end of strcmp if

for ii = 2 : numel( iter_vec )
## construct the API call for particular cross
query = [ query_begin , iter_vec{ ii } , '/candles?includeFirst=true&price=M&from=' , query_time ] ;
## call to use external Unix systems/Curl and return result
[ ~ , ret_JSON ] = system( query , RETURN_OUTPUT = 'TRUE' ) ;
## convert the returned JSON object to Octave structure
S = load_json( ret_JSON ) ;
## parse the returned structure S
if ( strcmp( fieldnames( S( 1 ) ) , 'errorMessage' ) == 0 ) ## no errorMessage in S
end_ix = numel( S.candles ) ; ## how many candles?
if ( S.candles{ end }.complete == 0 ) end_ix = end_ix - 1 ; endif ## account for incomplete candles
temp_retval = zeros( end_ix , 6 ) ;
for jj = 1 : end_ix
 date_time = strsplit( S.candles{ jj }.time , { '-' , 'T' , ':' } ) ;
 temp_retval( jj , 1 ) = str2double( date_time( 1 , 1 ) ) ; ## year
 temp_retval( jj , 2 ) = str2double( date_time( 1 , 2 ) ) ; ## month
 temp_retval( jj , 3 ) = str2double( date_time( 1 , 3 ) ) ; ## day
 temp_retval( jj , 4 ) = str2double( date_time( 1 , 4 ) ) ; ## hour
 temp_retval( jj , 5 ) = str2double( date_time( 1 , 5 ) ) ; ## min
 temp_retval( jj , 6 ) = str2double( S.candles{ jj }.mid.c ) ; ## candle close price  
endfor ## end of jj loop

## checks dates and times allignment before writing to retval
date_time_diffs_1 = setdiff( retval( : , 1 : 5 ) , temp_retval( : , 1 : 5 ) , 'rows' ) ; 
date_time_diffs_2 = setdiff( temp_retval( : , 1 : 5 ) , retval( : , 1 : 5 ) , 'rows' ) ;

 if ( isempty( date_time_diffs_1 ) && isempty( date_time_diffs_2 ) ) 
 ## there are no differences between retval dates and temp_retval dates 
 retval( : , ii + 5 ) = temp_retval( : , 6 ) ;
 
 elseif ( ~isempty( date_time_diffs_1 ) || ~isempty( date_time_diffs_2 ) )
 ## implies a difference between the date_times of retval and temp_retval, so merge them
 
 dn_retval = datenum( [ retval(:,1) , retval(:,2) , retval(:,3) , retval(:,4) , retval(:,5) ] ) ;
 dn_temp_retval = datenum( [ temp_retval(:,1) , temp_retval(:,2) , temp_retval(:,3) , temp_retval(:,4) , temp_retval(:,5) ] ) ;
 new_dn = unique( [ dn_retval ; dn_temp_retval ] ) ; new_date_vec = datevec( new_dn ) ; new_date_vec( : , 6 ) = [] ; 
 new_retval = [ new_date_vec , zeros( size( new_date_vec , 1 ) , 45 ) ] ;
 [ TF , S_IDX ] = ismember( new_retval( : , 1 : 5 ) , retval( : , 1 : 5 ) , 'rows' ) ;
 TF_ix = find( TF ) ; new_retval( TF_ix , 6 : end ) = retval( : , 6 : end ) ;
 [ TF , S_IDX ] = ismember( new_retval( : , 1 : 5 ) , temp_retval( : , 1 : 5 ) , 'rows' ) ;
 TF_ix = find( TF ) ; new_retval( TF_ix , ii + 5 ) = temp_retval( : , 6 ) ; 
 retval = new_retval ; 
 clear new_retval new_dn dn_temp_retval dn_retval date_time_diffs_1 date_time_diffs_2 ;
 
 else 
 error( 'Mismatch between dates and times for writing to retval.' ) ; 
 endif ## TF == S_IDX check

endif ## end of strcmp if

endfor ## ii loop

endfunction
At the moment there are almost 50 separate API calls nested within a loop, which of course is non-vectorised and inefficient, and if I find out how to make a batch API call to do this I shall rewrite the function.

This function is called in a script which uses the output matrix "retval" to then calculate the various currency strengths as outlined in the above linked posts. The total running time for this script is approximately 40 seconds from first call to appending to the index file on disk. I wrote this function to leverage my new found Oanda API knowledge to avoid having to accumulate an ever growing set of files on disk containing the raw 10 minute data.

I hope readers find this useful.

Sunday, 3 May 2020

Market Profile Chart in Octave

In a comment on my previous post, visualising Oanda's orderbook, a reader called Darren suggested that I was over complicating things and should perhaps use a more established methodology, namely Market Profile.

I had heard of Market Profile before Darren mentioned it, but had always assumed that it required access to data that I didn't readily have to hand, i.e. tick level data. With my recent work on Oanda's API in Octave that is no longer necessarily the case. However, downloading, storing and manipulating streams of tick data would be a whole new infrastructure project that I would have to implement in either R or Octave.

Instead of doing this I have done some research into Market Profile and come up with an alternative solution that can use the more readily available tick volume. One of the empirically observed assumptions of Market Profile is that on a "normal" day such volume is normally distributed and creates a "value area" that contains approximately 70% of the market action, which roughly corresponds to action falling within one standard deviation of the mean of said action, and this mean in turn roughly corresponds with what is termed the "point of control" (POC).

If one takes this at face value as being an accurate description of market action, it is possible to recreate the "normal" market profile with the following Octave code:
 ticks = norminv( linspace( 0 , 1 , vol( ii ) + 2 ) , ( high( ii ) + low( ii ) ) / 2 , ( high( ii ) - low( ii ) ) / 6 ) ;
 ticks = floor( ticks( 2 : end - 1 ) ./ tick_size .+ tick_size ) .* tick_size ;
 [ vals , bin_centres ] = hist( ticks , unique( ticks ) ) ;
What this does is create vol(ii)+2 linearly spaced tick values from 0 to 1, where vol(ii) is the tick volume for an aggregated period, i.e. an ohlc bar, and transforms these into normally distributed ticks with a mean of the midpoint of the bar and an assumed standard deviation of one sixth the high-low range, rounded to the nearest whole tick. The hist function then provides the counts of ticks per level (vals) at levels (bin_centres).

Below is a screen shot of recent EUR_USD forex prices at a resolution of 20 minute candlesticks from 17:00 EST on 28th April 2020 to end of week close at 17:00 EST 1st May 2020.
The silhouette chart at the bottom is the usual tick volume per bar and the horizontal histogram is the Market Profile of the 20 minute bars from the first bar to the first vertical green line, calculated as described above. All the visable vertical green lines represent the open at 07:00 BST, whilst the vertical red lines are the 17:00 EST closes. The horizontal blue line is the current POC at 07:00 BST, taking into account only the bars to the left of the first green line, i.e. the Asian overnight session.

Next is a video of the progression through time along the above chart: as time progesses the Market Profile histogram changes and new, blue POC lines are plotted, with the time progression being marked by the advancing green lines. During subsequent Asian sessions the histogram colour is plotted in red, and new POC lines formed in the Asian session are also plotted in red.


For easier viewing, this is a screen shot of the chart as it appears at the end of the video
For comparative purposes this is a screen shot of the same as above, but using 10 minute ohlc bars and 10 minute updates to the Market Profile
Readers should note that the scaling of the silhouette charts and histograms are not the same for both - they are hand scaled by me for visualisation purposes only.

For completeness, here is the Octave script used to produce the above
clear all ;
pkg load statistics ;

## load data
cd /home/dekalog/Documents/octave/oanda_data/20m ;
oanda_files_20m = glob( "*_ohlc_20m" ) ;
ix = 7 ;##input( 'Tradable? ' ) ;
data = dlmread( oanda_files_20m{ ix } ) ;
data( 1 : 146835 , : ) = [] ;

tick_size = 0.0001 ;

open = data( : , 18 ) ; high = data( : , 19 ) ; low = data( : , 20 ) ; close = data( : , 21 ) ; vol = data( : , 22 ) ;
## Create grid for day
max_high = max( high ) + 0.001 ; min_low = min( low ) - 0.001 ; grid = ( min_low : tick_size : max_high + 0.0001 ) ;
grid_ix = floor( grid ./ tick_size .+ tick_size ) .* tick_size ; 
market_profile = [ grid_ix ; zeros( 1 , size( grid_ix , 2 ) ) ] ;
asian_market_profile = [ grid_ix ; zeros( 1 , size( grid_ix , 2 ) ) ] ;
 
figure( 20 ) ; 
candle( high , low , close , open ) ; 
vline( 27 , 'g' ) ; vline( 72 , 'r' ) ; vline( 99 , 'g' ) ; vline( 144 , 'r' ) ; vline( 174 , 'g' ) ;
xlim( [ 0 size( open , 1 ) ] ) ;
ylim( [ grid_ix(1) grid_ix(end) ] ) ;
hold on ; plot( ( vol .* 0.0000004 ) .+ grid_ix( 1 ) , 'b' , 'linewidth' , 2 ) ; 
area( ( vol .* 0.0000004 ) .+ grid_ix( 1 ) , 'facecolor' , 'b' ) ; hold off ;

for ii = 1 : 27
 ticks = norminv( linspace( 0 , 1 , vol( ii ) + 2 ) , ( high( ii ) + low( ii ) ) / 2 , ( high( ii ) - low( ii ) ) / 6 ) ;
 ticks = floor( ticks( 2 : end - 1 ) ./ tick_size .+ tick_size ) .* tick_size ;
 [ vals , bin_centres ] = hist( ticks , unique( ticks ) ) ;
 vals_ix = find( ismember( grid_ix , bin_centres ) ) ;
 market_profile( 2 , vals_ix ) += vals ;
endfor

[ max_mp_val_old , max_mp_ix ] = max( market_profile( 2 , : ) ) ;

hold on ; figure( 20 ) ; H = barh( market_profile( 1 , : ) , market_profile( 2 , : ).*0.005 , 'c' ) ; hold off ;
hline( market_profile( 1 , max_mp_ix ) , 'b' ) ;

for ii = 28 : 72
 ticks = norminv( linspace( 0 , 1 , vol( ii ) + 2 ) , ( high( ii ) + low( ii ) ) / 2 , ( high( ii ) - low( ii ) ) / 6 ) ;
 ticks = floor( ticks( 2 : end - 1 ) ./ tick_size .+ tick_size ) .* tick_size ;
 vals = hist( ticks , unique( ticks ) ) ;
 vals_ix = find( ismember( grid_ix , unique( ticks ) ) ) ;
 market_profile( 2 , vals_ix ) += vals ;
 [ max_mp_val , max_mp_ix ] = max( market_profile( 2 , : ) ) ;
 hold on ; figure( 20 ) ; barh( market_profile( 1 , : ) , market_profile( 2 , : ).*0.005 , 'c' ) ; hold off ;
 vline( ii , 'g' ) ; 
 if ( max_mp_val > max_mp_val_old )
  hline( market_profile( 1 , max_mp_ix ) , 'b' ) ;
  max_mp_val_old = max_mp_val ;
 endif
 pause(0.01) ;
endfor

for ii = 73 : 99
 ticks = norminv( linspace( 0 , 1 , vol( ii ) + 2 ) , ( high( ii ) + low( ii ) ) / 2 , ( high( ii ) - low( ii ) ) / 6 ) ;
 ticks = floor( ticks( 2 : end - 1 ) ./ tick_size .+ tick_size ) .* tick_size ;
 vals = hist( ticks , unique( ticks ) ) ;
 vals_ix = find( ismember( grid_ix , unique( ticks ) ) ) ;
 market_profile( 2 , vals_ix ) += vals ;
 asian_market_profile( 2 , vals_ix ) += vals ;
 [ max_mp_val , max_mp_ix ] = max( market_profile( 2 , : ) ) ;
 hold on ; figure( 20 ) ; barh( market_profile( 1 , : ) , market_profile( 2 , : ).*0.005 , 'c' ) ; 
 figure( 20 ) ; barh( asian_market_profile( 1 , : ) , asian_market_profile( 2 , : ).*0.005 , 'r' ) ;
 hold off ;
 vline( ii , 'g' ) ; 
 if ( max_mp_val > max_mp_val_old )
  hline( market_profile( 1 , max_mp_ix ) , 'b' ) ;
  max_mp_val_old = max_mp_val ;
 endif
 pause(0.01) ;
endfor

[ ~ , max_mp_ix ] = max( asian_market_profile( 2 , : ) ) ;
hline( asian_market_profile( 1 , max_mp_ix ) , 'r' ) ;

for ii = 100 : 144
 ticks = norminv( linspace( 0 , 1 , vol( ii ) + 2 ) , ( high( ii ) + low( ii ) ) / 2 , ( high( ii ) - low( ii ) ) / 6 ) ;
 ticks = floor( ticks( 2 : end - 1 ) ./ tick_size .+ tick_size ) .* tick_size ;
 vals = hist( ticks , unique( ticks ) ) ;
 vals_ix = find( ismember( grid_ix , unique( ticks ) ) ) ;
 market_profile( 2 , vals_ix ) += vals ;
 [ max_mp_val , max_mp_ix ] = max( market_profile( 2 , : ) ) ;
 hold on ; figure( 20 ) ; barh( market_profile( 1 , : ) , market_profile( 2 , : ).*0.005 , 'c' ) ;
 figure( 20 ) ; barh( asian_market_profile( 1 , : ) , asian_market_profile( 2 , : ).*0.005 , 'r' ) ; 
 hold off ;
 vline( ii , 'g' ) ; 
 if ( max_mp_val > max_mp_val_old )
  hline( market_profile( 1 , max_mp_ix ) , 'b' ) ;
  max_mp_val_old = max_mp_val ;
 endif
 pause(0.01) ;
endfor

[ max_mp_val , max_mp_ix ] = max( market_profile( 2 , 101 : end ) ) ;
max_mp_val_old = max_mp_val ;
hline( market_profile( 1 , max_mp_ix + 100 ) , 'b' ) ;

for ii = 145 : 174
 ticks = norminv( linspace( 0 , 1 , vol( ii ) + 2 ) , ( high( ii ) + low( ii ) ) / 2 , ( high( ii ) - low( ii ) ) / 6 ) ;
 ticks = floor( ticks( 2 : end - 1 ) ./ tick_size .+ tick_size ) .* tick_size ;
 vals = hist( ticks , unique( ticks ) ) ;
 vals_ix = find( ismember( grid_ix , unique( ticks ) ) ) ;
 market_profile( 2 , vals_ix ) += vals ;
 asian_market_profile( 2 , vals_ix ) += vals ;
 [ max_mp_val , max_mp_ix ] = max( market_profile( 2 , 101 : end ) ) ;
 hold on ; figure( 20 ) ; barh( market_profile( 1 , : ) , market_profile( 2 , : ).*0.005 , 'c' ) ; 
 figure( 20 ) ; barh( asian_market_profile( 1 , : ) , asian_market_profile( 2 , : ).*0.005 , 'r' ) ;
 hold off ;
 vline( ii , 'g' ) ; 
 if ( max_mp_val > max_mp_val_old )
  hline( market_profile( 1 , max_mp_ix + 100 ) , 'b' ) ;
  max_mp_val_old = max_mp_val ;
 endif
 pause(0.01) ;
endfor

[ ~ , max_mp_ix ] = max( asian_market_profile( 2 , 101 : end ) ) ;
hline( asian_market_profile( 1 , max_mp_ix + 100 ) , 'r' ) ;

for ii = 175 : size( open , 1 )
 ticks = norminv( linspace( 0 , 1 , vol( ii ) + 2 ) , ( high( ii ) + low( ii ) ) / 2 , ( high( ii ) - low( ii ) ) / 6 ) ;
 ticks = floor( ticks( 2 : end - 1 ) ./ tick_size .+ tick_size ) .* tick_size ;
 vals = hist( ticks , unique( ticks ) ) ;
 vals_ix = find( ismember( grid_ix , unique( ticks ) ) ) ;
 market_profile( 2 , vals_ix ) += vals ;
 [ max_mp_val , max_mp_ix ] = max( market_profile( 2 , 101 : end ) ) ;
 hold on ; figure( 20 ) ; barh( market_profile( 1 , : ) , market_profile( 2 , : ).*0.005 , 'c' ) ; 
 figure( 20 ) ; barh( asian_market_profile( 1 , : ) , asian_market_profile( 2 , : ).*0.005 , 'r' ) ;
 hold off ;
 vline( ii , 'g' ) ; 
 if ( max_mp_val > max_mp_val_old )
  hline( market_profile( 1 , max_mp_ix + 100 ) , 'b' ) ;
  max_mp_val_old = max_mp_val ;
 endif
 pause(0.01) ;
endfor
As just noted above for the scaling of the charts/video, readers should also be aware that within this script there are a lot of magic numbers that are unique to the data and scaling being used; therefore, this is not a plug in and play video script.

My thanks to the reader Darren, who suggested that I look into Market Profile. More in due course.

Wednesday, 15 April 2020

Generic Octave_Oanda_API Function

My last two posts have shown Octave functions that use the Oanda API to access and download data. In the first of these posts I said that I would post more code for further functions as and when I write them. However, on further reflection this would be unnecessary as the generic form of any such function is:

1) create the required headers
## set up the headers
query = [ 'curl -s --compressed -H "Content-Type: application/json"' ] ; ## -s is silent mode for Curl for no paging to terminal
query = [ query , ' -H "Authorization: Bearer XXXXXXXXXXXXXXXXXXXXXXXXXXXXXXXXXXXXXXXXXXXXXXXXXXXXXXXXXXXXXXXXX"' ] ;
2) create the required API call
## construct the actual API call for instrument, year, month, day, hour and min
query = [ query , ' "https://api-fxtrade.oanda.com/v3/instruments/' , toupper( cross ) , "/orderBook?time=" , num2str( year ) , '-' , ...
num2str( month , "%02d" ) , '-' , num2str( day , "%02d" ) , 'T' , num2str( hour , "%02d" ) , '%3A' , num2str( min , "%02d" ) , '%3A00.000Z"' ] ;
3) extract the data from the returned JSON object
## call to use external Unix systems/Curl and return result
[ ~ , ret_JSON ] = system( query , RETURN_OUTPUT = 'TRUE' ) ;

## convert the returned JSON object to Octave structure
ret_JSON = load_json( ret_JSON ) ;
Providing the required libraries are installed on your system (see first post) the above is all that is needed for any API call - just change the details in the second code box - in the example above the code is to download the historical orderbook for a given forex currency cross/tradable at a specific date/time, given as function input variables.

I have found that the main difficulty lies in parsing the returned data structure, which can consist of nested Structures/Cell-Arrays. Below is code, liberally commented, that shows how to parse the above orderbook API call and add the 20 orderbook levels above/below the orderbook price to historical orderbook files already on disc
clear all ;
cd /home/dekalog/Documents/octave/oanda_data/20m ;

orderbooks = glob( '*_historical_orderbook_snapshots' ) ;
## {
##   [1,1] = aud_jpy_historical_orderbook_snapshots
##   [2,1] = aud_usd_historical_orderbook_snapshots
##   [3,1] = eur_aud_historical_orderbook_snapshots
##   [4,1] = eur_chf_historical_orderbook_snapshots
##   [5,1] = eur_gbp_historical_orderbook_snapshots
##   [6,1] = eur_jpy_historical_orderbook_snapshots
##   [7,1] = eur_usd_historical_orderbook_snapshots
##   [8,1] = gbp_chf_historical_orderbook_snapshots
##   [9,1] = gbp_jpy_historical_orderbook_snapshots
##   [10,1] = gbp_usd_historical_orderbook_snapshots
##   [11,1] = nzd_usd_historical_orderbook_snapshots
##   [12,1] = usd_cad_historical_orderbook_snapshots
##   [13,1] = usd_chf_historical_orderbook_snapshots
##   [14,1] = usd_jpy_historical_orderbook_snapshots
##   [15,1] = xag_usd_historical_orderbook_snapshots
##   [16,1] = xau_usd_historical_orderbook_snapshots
## }
data_20m = glob( '*_ohlc_20m' ) ;

for ii = 1 : 1 ## begin the instrument loop

str_split = strsplit( data_20m{ ii } , "_" ) ;
cross = strjoin( str_split( 1 : 2 ) , "_" ) ; ## get the tradable, e.g. 'eur_usd'

## create a unix system command to read the last row of 20 min ohlc of filename
unix_command = [ "tail -1" , " " , data_20m{ ii } ] ; 
[ ~ , data ] = system( unix_command ) ;
data = strsplit( data , { "," , "\n" } ) ; ## gives a cell arrayfun
## covert last date/time to numeric format
data_20m_last = [ str2num(data{1}) , str2num(data{2}) , str2num(data{3}) , str2num(data{4}) ,str2num(data{5}) ] ;

## create a unix system command to read the last row of historical_orderbook_snapshots of filename
unix_command = [ "tail -1" , " " , orderbooks{ ii } ] ; 
[ ~ , data ] = system( unix_command ) ;
data = strsplit( data , { "," , "\n" } ) ; ## gives a cell arrayfun
## covert last date/time to numeric format
data_ordbk_last = [ str2num(data{1}) , str2num(data{2}) , str2num(data{3}) , str2num(data{4}) ,str2num(data{5}) ] ;

time_diff = datenum( data_20m_last ) - datenum( data_ordbk_last ) ;
## only run following code if there is more orderbook data to download to match 20min data already on file
 if ( time_diff > 0 )

 no_rows_diff = ceil( time_diff * 72 ) ; ## there are 72 x 20 minute bars per day
 ## create a unix system command to read the last no_rows_diff of 20 min ohlc of filename
 unix_command = [ "tail -" , num2str( no_rows_diff ) , " " , data_20m{ ii } ] ; 
 [ ~ , data ] = system( unix_command ) ;
 data = strsplit( data , { "," , "\n" } ) ; ## gives a cell arrayfun
 data = data( 1 : size( data , 2 ) - 1 ) ; ## get rid of last empty cell
 data = reshape( data , 22 , no_rows_diff )' ;
 
  for jj = 1 : no_rows_diff
   if ( str2double(data{jj,1})==data_ordbk_last(1) && str2double(data{jj,2})==data_ordbk_last(2) && ...
        str2double(data{jj,3})==data_ordbk_last(3) && str2double(data{jj,4})==data_ordbk_last(4) && ...
        str2double(data{jj,5})==data_ordbk_last(5) )
    begin_ix = jj + 1 ;
    break ;
   endif
  endfor ## end of jj = 1 : no_rows_diff loop

 new_orderbook_data = zeros( no_rows_diff - ( begin_ix - 1 ) , 88 ) ;

 kk = 0 ; ## initialise kk counter to loop over new_orderbook_data rows
  for jj = begin_ix : no_rows_diff ## loop over structure S from begin_ix to no_rows_diff
   kk = kk + 1 ; ## increment counter
   
   ## write dates and times to new_orderbook_data
   new_orderbook_data( kk , 1 ) = str2double( data{ jj , 1 } ) ;
   new_orderbook_data( kk , 2 ) = str2double( data{ jj , 2 } ) ;
   new_orderbook_data( kk , 3 ) = str2double( data{ jj , 3 } ) ;
   new_orderbook_data( kk , 4 ) = str2double( data{ jj , 4 } ) ;
   new_orderbook_data( kk , 5 ) = str2double( data{ jj , 5 } ) ;
   
   ## download the orderbook structure, S
   S = get_historical_orderbook( cross , new_orderbook_data( kk , 1 ) , new_orderbook_data( kk , 2 ) , new_orderbook_data( kk , 3 ) , ...
                                  new_orderbook_data( kk , 4 ) , new_orderbook_data( kk , 5 ) ) ;

   ## write the orderBook Price to new_orderbook_data
   new_orderbook_data( kk , 6 ) = str2double( S.orderBook.price ) ;

    ######## find where str2double( S.orderBook.price ) is within S ########
    for ix = 1 : size( S.orderBook.buckets , 2 )
     if ( str2double( S.orderBook.buckets{ ix }.price ) >= str2double( S.orderBook.price ) )
      mid_ix = ix ;  
      break ;
     endif
    endfor ## end ix loop

    if ( ( str2double( S.orderBook.price ) - str2double( S.orderBook.buckets{ mid_ix - 1 }.price ) ) < ...
         ( str2double( S.orderBook.buckets{ mid_ix }.price ) ) - str2double( S.orderBook.price ) ) ## refine accuracy of mid_ix
      mid_ix = mid_ix - 1 ;
    endif
    ########## index for str2double( S.orderBook.price ) found #############

  ## actual writing to file: +/- 20 lines around mid_ix, the orderbook_price
  orderbook_begin_ix = mid_ix - 20 ; orderbook_end_ix = mid_ix + 20 ;
  
  ## format of file to write is:
  ## year month day hour min orderbook_price long% short%
   xx = 7 ; ## initialise column counter
   for zz = orderbook_begin_ix : orderbook_end_ix
    new_orderbook_data( kk , xx ) = str2double( S.orderBook.buckets{ zz }.longCountPercent ) ;
    new_orderbook_data( kk , xx + 41 ) = str2double( S.orderBook.buckets{ zz }.shortCountPercent ) ;
    xx = xx + 1 ; ## increment column counter
   endfor ## end of zz filling loop
   
  endfor ## end of jj for loop to fill one line of new_orderbook_data

 endif ## end of ( time_diff > 0 ) if statement

dlmwrite( orderbooks{ ii } , new_orderbook_data , '-append' ) ;

endfor ## end of ii instrument for loop

## The downloaded Structure S looks like
## parse the character structure S and write to new_orderbook_data
##  isstruct(S)
##  ans = 1
##  fieldnames(S)
##  ans =
##  {
##    [1,1] = orderBook
##  }
##
##  >> fieldnames(S.orderBook)
##  ans =
##  {
##    [1,1] = instrument
##    [2,1] = time
##    [3,1] = unixTime
##    [4,1] = price
##    [5,1] = bucketWidth
##    [6,1] = buckets
##  }
##
##  S.orderBook.instrument
##  ans = AUD_JPY
##
##  S.orderBook.time
##  ans = 2020-04-05T21:00:00Z
##
##  S.orderBook.unixTime
##  ans = 1586120400
##
##  S.orderBook.price
##  ans = 65.080
##
##  S.orderBook.bucketWidth
##  ans = 0.050
##
##  iscell( S.orderBook.buckets )
##  ans = 1
The code uses loops, which is usually frowned upon in favour of vectorised code, but I am not aware of how to vectorise the parsing of the structure. This code also shows the use of the unix_command to use -tail to read just the last 'n' lines of the files on disc and thus avoid loading complete, and perhaps very large, files.

Saturday, 11 April 2020

Get Latest Pricing Octave_Oanda_API Function

Following on from my my earlier, simple account summary API function, here is a function which downloads the latest pricing information for a given currency cross/tradable
## Copyright (C) 2020 dekalog
## 
## This program is free software: you can redistribute it and/or modify it
## under the terms of the GNU General Public License as published by
## the Free Software Foundation, either version 3 of the License, or
## (at your option) any later version.
## 
## This program is distributed in the hope that it will be useful, but
## WITHOUT ANY WARRANTY; without even the implied warranty of
## MERCHANTABILITY or FITNESS FOR A PARTICULAR PURPOSE.  See the
## GNU General Public License for more details.
## 
## You should have received a copy of the GNU General Public License
## along with this program.  If not, see
## .

## -*- texinfo -*- 
## @deftypefn {} {@var{best_bid}, @var{best_ask} =} get_current_pricing (@var{currency_cross})
##
## Returns the current pricing (best bid and ask prices) for CURRENCY_CROSS given by the Oanda API call,
## for example,
##
## "https://api-fxtrade.oanda.com/v3/accounts//pricing?instruments=EUR_USD"
##
## for CURRENCY_CROSS == 'eur_usd' (input is a character vector)
##
## Internally the function runs system() which calls the Curl
## library for the actual API download. The function is hard coded
## with the account token and account ID.
##
## @seealso{}
## @end deftypefn

## Author: dekalog 
## Created: 2020-04-05

function [ best_bid , best_ask ] = get_current_pricing ( cross )
 
if ( ischar( cross ) == 0 )
   error( 'Input must be a character vector for currency crosss/tradable, e.g. "eur_usd"' ) ;
endif
 
## set up the headers
query = [ 'curl -s -H "Content-Type: application/json"' ] ; ## -s is silent mode for Curl for no paging to terminal
query = [ query , ' -H "Authorization: Bearer 63926d856d2f6d7ed16ff014c8227042-3ceb540b828a7380b02dfdb273e7ab68"' ] ;

## construct the API call
query = [ query , ' "https://api-fxtrade.oanda.com/v3/accounts/001-004-225017-001/pricing?instruments=' ] ;
query = [ query , toupper( cross ) , '"' ] ;

## call to use external Unix systems/Curl and return result
[ ~ , ret_JSON ] = system( query , RETURN_OUTPUT = 'TRUE' ) ;

## convert the returned JSON object to Octave structure
s = load_json( ret_JSON ) ;

best_bid = s.prices{1}.bids{1}.price ;
best_ask = s.prices{1}.asks{1}.price ;

endfunction

## Typically, the retval output structure s will look like this:-
##
## s =
##
##   scalar structure containing the fields:
##
##     time = 2020-04-10T17:42:13.317424312Z
##     prices =
##     {
##       [1,1] =
##
##         scalar structure containing the fields:
##
##           type = PRICE
##           time = 2020-04-10T17:42:09.734257300Z
##           bids =
##           {
##             [1,1] =
##
##               scalar structure containing the fields:
##
##                 price: 1x7 sq_string
##                 liquidity: 1x1 uint32 scalar
##
##             [1,2] =
##
##               scalar structure containing the fields:
##
##                 price: 1x7 sq_string
##                 liquidity: 1x1 uint32 scalar
##
##             [1,3] =
##
##               scalar structure containing the fields:
##
##                 price: 1x7 sq_string
##                 liquidity: 1x1 uint32 scalar
##
##             [1,4] =
##
##               scalar structure containing the fields:
##
##                 price: 1x7 sq_string
##                 liquidity: 1x1 uint32 scalar
##
##           }
##
##           asks =
##           {
##             [1,1] =
##
##               scalar structure containing the fields:
##
##                 price: 1x7 sq_string
##                 liquidity: 1x1 uint32 scalar
##
##             [1,2] =
##
##               scalar structure containing the fields:
##
##                 price: 1x7 sq_string
##                 liquidity: 1x1 uint32 scalar
##
##             [1,3] =
##
##               scalar structure containing the fields:
##
##                 price: 1x7 sq_string
##                 liquidity: 1x1 uint32 scalar
##
##             [1,4] =
##
##               scalar structure containing the fields:
##
##                 price: 1x7 sq_string
##                 liquidity: 1x1 uint32 scalar
##
##           }
##
##           closeoutBid = 1.09358
##           closeoutAsk = 1.09388
##           status = tradeable
##           tradeable = 1
##           unitsAvailable =
##
##             scalar structure containing the fields:
##
##               default: 1x1 scalar struct
##               openOnly: 1x1 scalar struct
##               reduceFirst: 1x1 scalar struct
##               reduceOnly: 1x1 scalar struct
##
##           quoteHomeConversionFactors =
##
##             scalar structure containing the fields:
##
##               positiveUnits: 1x10 sq_string
##               negativeUnits: 1x10 sq_string
##
##           instrument = EUR_USD
##
##     }
##
## where bid and ask fields etc. just give information rather than values.
## Can access values by, e.g. values = s.prices
## to get
##
## b =
## {
##   [1,1] =
##
##     scalar structure containing the fields:
##
##       type = PRICE
##       time = 2020-04-10T17:48:17.265291655Z
##       bids =
##       {
##         [1,1] =
##
##           scalar structure containing the fields:
##
##             price = 1.09352
##             liquidity = 1000000
##
##         [1,2] =
##
##           scalar structure containing the fields:
##
##             price = 1.09351
##             liquidity = 2000000
##
##         [1,3] =
##
##           scalar structure containing the fields:
##
##             price = 1.09350
##             liquidity = 2000000
##
##         [1,4] =
##
##           scalar structure containing the fields:
##
##             price = 1.09348
##             liquidity = 5000000
##
##       }
##
##       asks =
##       {
##         [1,1] =
##
##           scalar structure containing the fields:
##
##             price = 1.09393
##             liquidity = 1000000
##
##         [1,2] =
##
##           scalar structure containing the fields:
##
##             price = 1.09395
##             liquidity = 2000000
##
##         [1,3] =
##
##           scalar structure containing the fields:
##
##             price = 1.09396
##             liquidity = 2000000
##
##         [1,4] =
##
##           scalar structure containing the fields:
##
##             price = 1.09397
##             liquidity = 5000000
##
##       }
##
##       closeoutBid = 1.09348
##       closeoutAsk = 1.09397
##       status = tradeable
##       tradeable = 1
##       unitsAvailable =
##
##         scalar structure containing the fields:
##
##           default =
##
##             scalar structure containing the fields:
##
##               long: 1x6 sq_string
##               short: 1x6 sq_string
##
##           openOnly =
##
##             scalar structure containing the fields:
##
##               long: 1x6 sq_string
##               short: 1x6 sq_string
##
##           reduceFirst =
##
##             scalar structure containing the fields:
##
##               long: 1x6 sq_string
##               short: 1x6 sq_string
##
##           reduceOnly =
##
##             scalar structure containing the fields:
##
##               long: 1x1 sq_string
##               short: 1x1 sq_string
##
##
##       quoteHomeConversionFactors =
##
##         scalar structure containing the fields:
##
##           positiveUnits = 0.80113441
##           negativeUnits = 0.80178317
##
##       instrument = EUR_USD
##
## }
##
## where some of the values are now "viewable" in terminal.
##
## to do this directly do
##
## s.prices{1}.asks{1}.price, which  will give 1.09393
##
## and 
##
## s.prices{1}.asks{1}.liquidity, which will give 1000000
The function returns are the best bid and ask prices; however, it would be a simple enough task for readers to edit the function to get further levels, a la Market depth, liquidity at these levels and some other price metrics. There is a comment section at the end of the function which shows how to do this.

I wrote this function with a view to it perhaps becoming the basis of a client-side, trailing stop functionality. Enjoy!

Sunday, 5 April 2020

First Octave Function using Oanda API

As part of my on-going code revision I have written my first Octave function to use the Oanda API. This is just a simple "proof of concept" function which downloads an account summary.
## Copyright (C) 2020 dekalog
## 
## This program is free software: you can redistribute it and/or modify it
## under the terms of the GNU General Public License as published by
## the Free Software Foundation, either version 3 of the License, or
## (at your option) any later version.
## 
## This program is distributed in the hope that it will be useful, but
## WITHOUT ANY WARRANTY; without even the implied warranty of
## MERCHANTABILITY or FITNESS FOR A PARTICULAR PURPOSE.  See the
## GNU General Public License for more details.
## 
## You should have received a copy of the GNU General Public License
## along with this program.  If not, see
## .

## -*- texinfo -*- 
## @deftypefn {} {@var{retval} =} account_summary ()
##
## Returns the Oanda account summary given by the Oanda API call
##
## "https://api-fxtrade.oanda.com/v3/accounts//summary"
##
## Internally the function runs system() which calls the Curl
## library for the actual API download. The function is hard coded
## with the account token and account ID.
## 
## @seealso{}
## @end deftypefn

## Author: dekalog 
## Created: 2020-04-04

function retval = account_summary ()

## set up the headers
query = [ 'curl -s -H "Content-Type: application/json"' ] ; ## -s is silent mode for Curl for no paging to terminal
query = [ query , ' -H "Authorization: Bearer XXXXXXXXXXXXXXXXXXXXXXXXXXXXXXXXXXXXXXXXXXXXXXXXXXXXXXXXXXXXXXXXX"' ] ;

## construct the API call
query = [ query , ' "https://api-fxtrade.oanda.com/v3/accounts/XXX-XXX-XXXXXX-XXX/summary"' ] ;

## call to use external Unix systems/Curl and return result
[ ~ , retval ] = system( query , RETURN_OUTPUT = 'TRUE' ) ;

## convert the returned json object to Octave structure
retval = load_json( retval ) ;

endfunction
The function uses the Curl library, so obviously this must be installed on your system, and to convert the returned JSON object to a native Octave structure the Octave wrapper function available from this Github, https://github.com/Andy1978/octave-rapidjson, is used. For this wrapper function to work rapidjson must also be installed.

I shall probably write more such Octave-OandaAPI functions for my particular use cases and will blog about them as and when I do so.