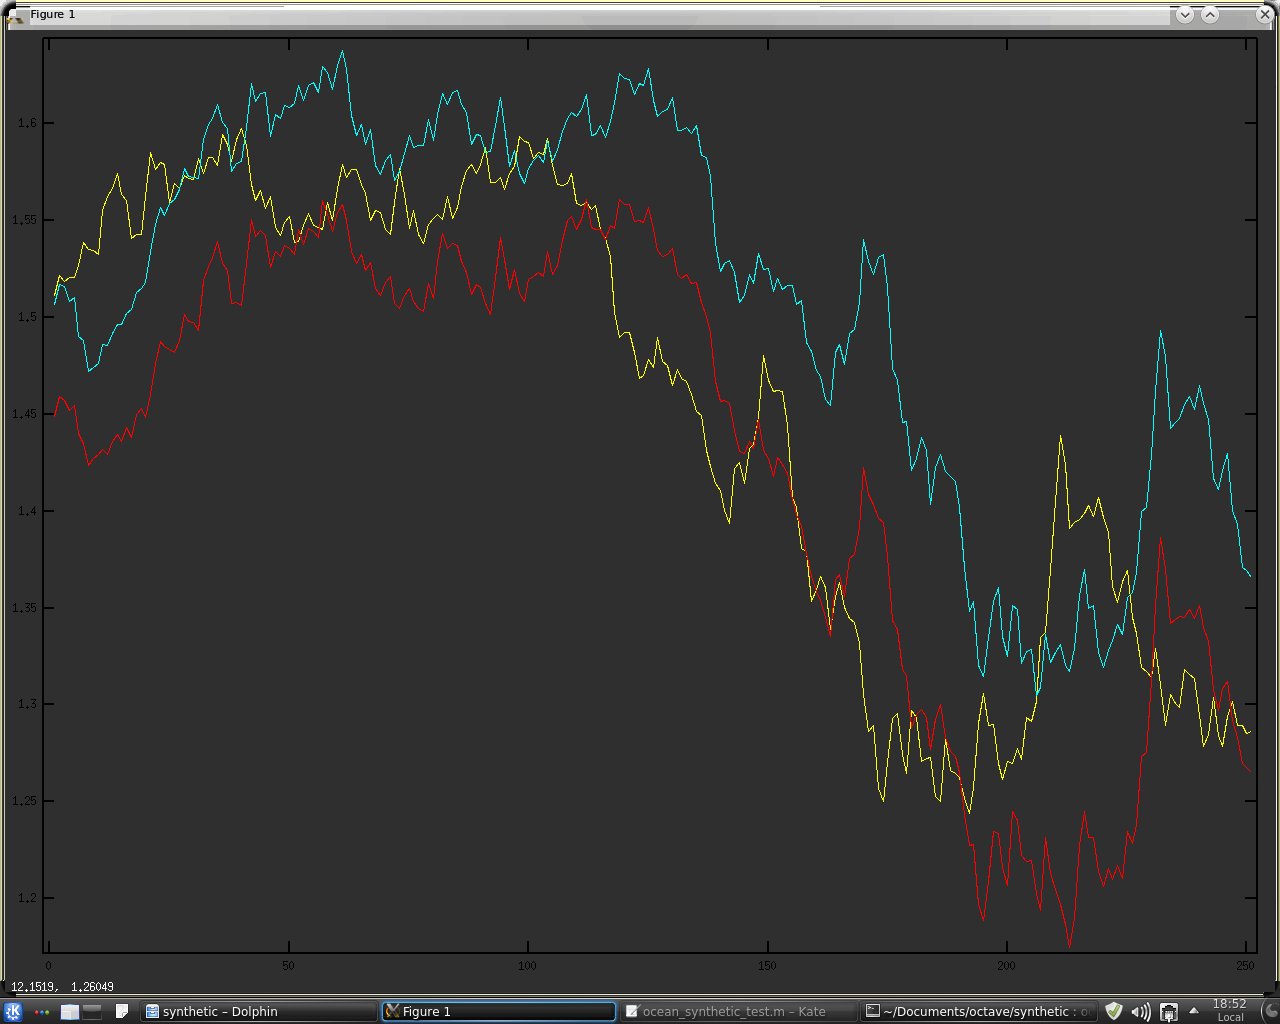
The basic premise, taken from Brownian motion, is that the natural log of price changes, on average, at a rate proportional to the square root of time. Take, for example, a period of 5 leading up to the "current bar." If we take a 5 period simple moving average of the absolute differences of the log of prices over this period, we get a value for the average 1 bar price movement over this period. This value is then multiplied by the square root of 5 and added to and subtracted from the price 5 days ago to get an upper and lower bound for the current bar. If the current bar lies between the bounds, we say that price movement over the last 5 periods is consistent with Brownian motion and declare an absence of trend, i.e. a sideways market. If the current bar lies outside the bounds, we declare that price movement over the last 5 bars is not consistent with Brownian motion and that a trend is in force, either up or down depending on which bound the current bar is beyond. The following 3 charts show this concept in action, for consecutive periods of 5, 13 and 21, taken from the Fibonacci Sequence:


The rough working Octave code that produced the above charts is given below.
clear all

data = load("-ascii","eurusd") ;
% length = input( 'Enter length of look back for calculations: ' ) ;
% sq_rt = sqrt( length ) ;
close = data(:,7) ;
abslogdiff = abs( [ 0 ; diff( log(close) ) ] ) ;

lngth = 3 ;
sq_rt = sqrt( lngth ) ;
sma3 = sma(abslogdiff,lngth) ;
ub = exp(shift(log(close),lngth).+(sma3.*sq_rt)) ;
lb = exp(shift(log(close),lngth).-(sma3.*sq_rt)) ;

all_ub = ub ;
all_lb = lb ;

lngth = 5 ;
sq_rt = sqrt( lngth ) ;
sma5 = sma(abslogdiff,5) ;
ub = exp(shift(log(close),lngth).+(sma5.*sq_rt)) ;
lb = exp(shift(log(close),lngth).-(sma5.*sq_rt)) ;

all_ub = all_ub .+ ub ;
all_lb = all_lb .+ lb ;

lngth = 8 ;
sq_rt = sqrt( lngth ) ;
sma8 = sma(abslogdiff,lngth) ;
ub = exp(shift(log(close),lngth).+(sma8.*sq_rt)) ;
lb = exp(shift(log(close),lngth).-(sma8.*sq_rt)) ;

all_ub = all_ub .+ ub ;
all_lb = all_lb .+ lb ;

lngth = 13 ;
sq_rt = sqrt( lngth ) ;
sma13 = sma(abslogdiff,lngth) ;
ub = exp(shift(log(close),lngth).+(sma13.*sq_rt)) ;
lb = exp(shift(log(close),lngth).-(sma13.*sq_rt)) ;

all_ub = all_ub .+ ub ;
all_lb = all_lb .+ lb ;

lngth = 21 ;
sq_rt = sqrt( lngth ) ;
sma21 = sma(abslogdiff,lngth) ;
ub = exp(shift(log(close),lngth).+(sma21.*sq_rt)) ;
lb = exp(shift(log(close),lngth).-(sma21.*sq_rt)) ;

all_ub = ( all_ub .+ ub ) ./ 5 ;
all_lb = ( all_lb .+ lb ) ./ 5 ;

 plot(close(1850:2100,1),'y',ub(1850:2100,1),'c',lb(1850:2100,1),'r')
%plot(close,'y',ub,'c',lb,'r')
6 comments:
I really like this idea as an indicator for strong price moves. Time to write some code Thanks!
P.S. your blog is awesome keep up the good work
Thanks for the kind words.
I also really like this idea for use as a trend indicator. Perhaps built into an existing system as a trend filter.
First congratulation for running this blog. I read it from the beginning till end and really gaveme a lot of inspiration
About me. Seems we follow similar paths. First I started with DSP methods base on Ehlers publications, than after extensive evaluations I switched to AI methods, I'm an author of this thread
http://www.trade2win.com/boards/trading-software/105880-3rd-generation-nn-deep-learning-deep-belief-nets-restricted-boltzmann-machines.html
So my few comments which maybe can be useful.
NN classifier. Why not to try more advanced classifiers specially designed to analyze big data file like e.g. pegassos or libocas. In my case I just developed interface MATLAB-WEKA to have access to all
WEKA algorithms, in my thread I compare performance like 10 algos at the same time.
Evaluations methods. I believe to evaluate classifier you need to generate full confusion matrix to not only accuracy or precision measures as in this case you really don't know what is a rate of false positives. Also
ROC and AUC curves can be useful.
Crossvalidation. Are you sure that this method is correct for time series evaluation ????? In such case you introduce future leaks i.e. train on data which occurred after test data !!!! Why not to do Walk Forward tests to see real performance.
Some time ago i posted WalkForward result of all ehler strategies here
http://www.forexfactory.com/showthread.php?p=4154734#post4154734
In general this thread in forexfactory is worth to read, some guys with very high expert level in DSP were posting there.
Beside this in my opinion just checking the errors of the averages/filters is a bit disconnected from reality as it don't show how those indicators will work with the strategy
As for decomposition of the prices. I 100% agree they must be decomposed somehow. Some method what you didn't mention
are like:
Stationary Subspace Analysis (SSA) (decomposition to stationary/non stationary parts)
MATLAB toolbox http://www.user.tu-berlin.de/paulbuenau/ssa/toolbox/
Singular Spectrum Analysis (SSA) info everywhere
Empirical Mode Decomposition EMD (Hilbert/Huang)
http://rcada.ncu.edu.tw/research1.htm
fractiona Brownian motion is possible to generate with different values of Hurst exponent using Wavelet MATLAB toolbox.
Hope it helps.
Krzysztof
I tried to implement with different programming language but I failed. I can't understand well Octave code. The description above looks a little different then code, but I am not sure. Would you please be so kind and publish a mathematical expression of your method?
Piotr,
Rather than publish a mathematical expression of the method in a forthcoming post I shall give C++ .oct code for this idea. The standard C++ looping structure might be easier to follow than vectorised Octave code.
Post a Comment