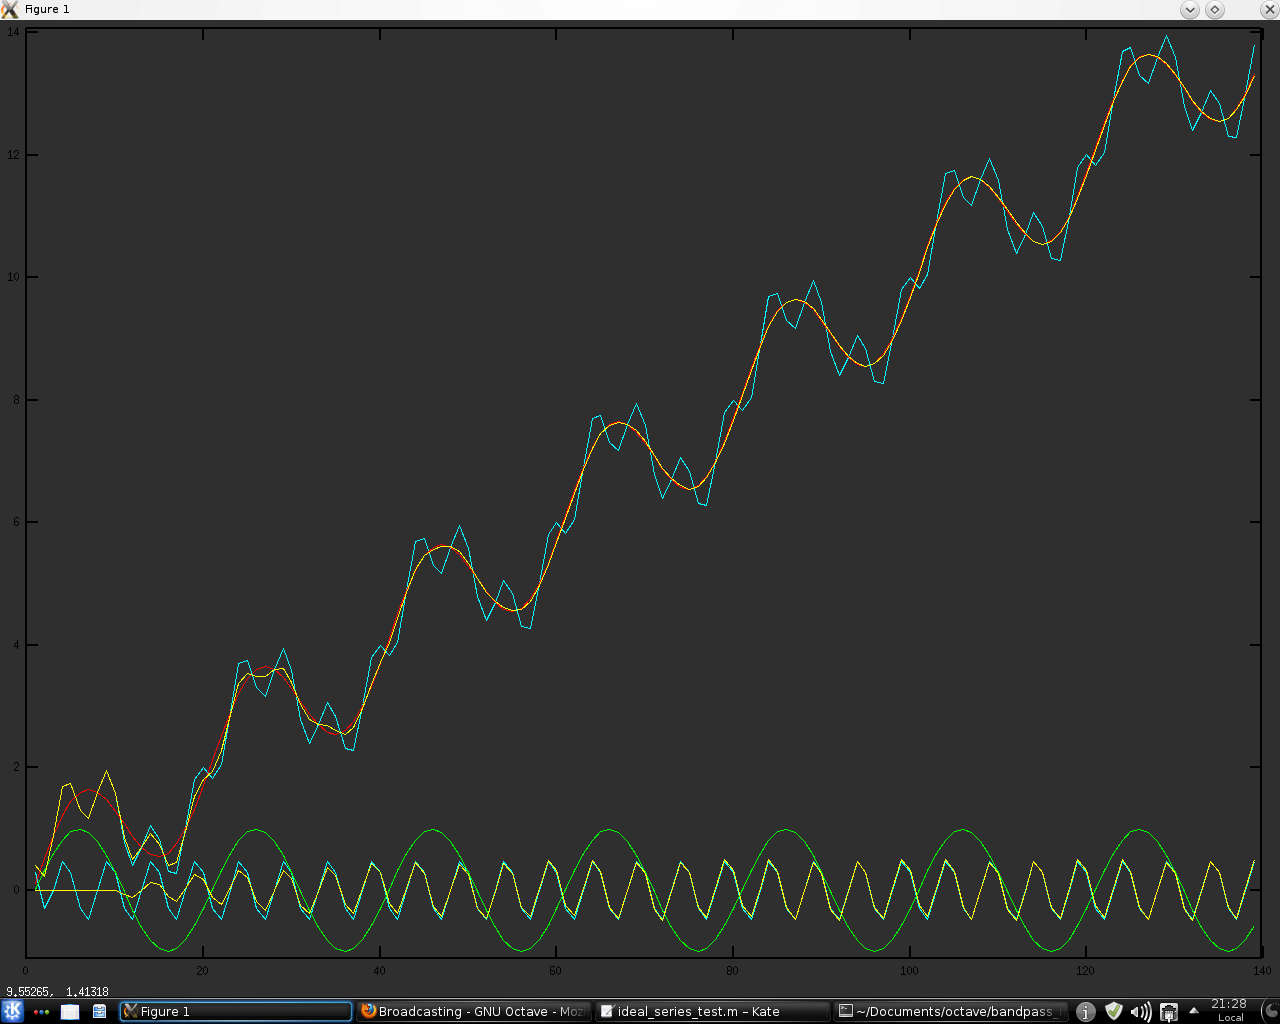
In an attempt to improve my NN system I have recently been thinking of some possibly useful tweaks to the data destined to be the input for the system. Long time readers of this blog will know that the NN system has been trained on my "idealised" data, a typical example of which might look like the red "price series" in the chart below.
These "idealised" series are modelled as simple combinations of linear trend plus a dominant cycle, represented above by the green sine wave at the bottom of the chart. For NN training purposes a mass of training data was created by phase shifting the sine wave and altering the linear trend. However, real data is much more like the cyan "price series," which is modelled as a combination of the linear trend, the dominant or "major" green cycle and a "minor" cyan cycle. It would be possible to create additional NN training data by creating numerous training series comprised of two cycles plus trend, but due to the
curse of dimensionality that way madness lies, in addition to the inordinate amount of time it would take to train the NNs.
So the problem becomes one of finding a principled method of transforming the cyan "real data" to be more like the "idealised" red data my NNs were trained on, and a possible answer might be the use of my
bandpass indicator. Shown below is a chart of said bandpass indicator overlaid on the above chart, in yellow. The bandpass is set to pass only the "minor" cycle and then this is subtracted from the "real data" to give an
approximation of the red "idealised" data. This particular instance calculates the bandpass with a moving window with a look back length set to the period of the "minor" cycle, whilst the following is a fully recursive implementation. It can be seen that this
recursive implementation is much better on this contrived toy example. However, I think this method shows promise and I intend to pursue it further. More in due course.


No comments:
Post a Comment